Reporting
Purpose and when to use
Divi Membership has a current Reports dashboard and a legacy Reporting screen. The current dashboard covers subscription, revenue, and trial analysis. The legacy screen remains the place for coupon analytics.
Where to find reports
- Divi Engine → Divi Membership → Reports — Current dashboard: overview, Charts & Analytics, Subscriptions, Revenue, Trial Analytics, and Export Data.
- Divi Membership → Reporting — Legacy tabs: Revenue, Signups, and Coupons. Use Coupons for coupon usage and coupon CSV export.
The current dashboard opens with a date range selector (for example Last 30 days) and a refresh control. Overview stats and charts respect that range.
Overview cards
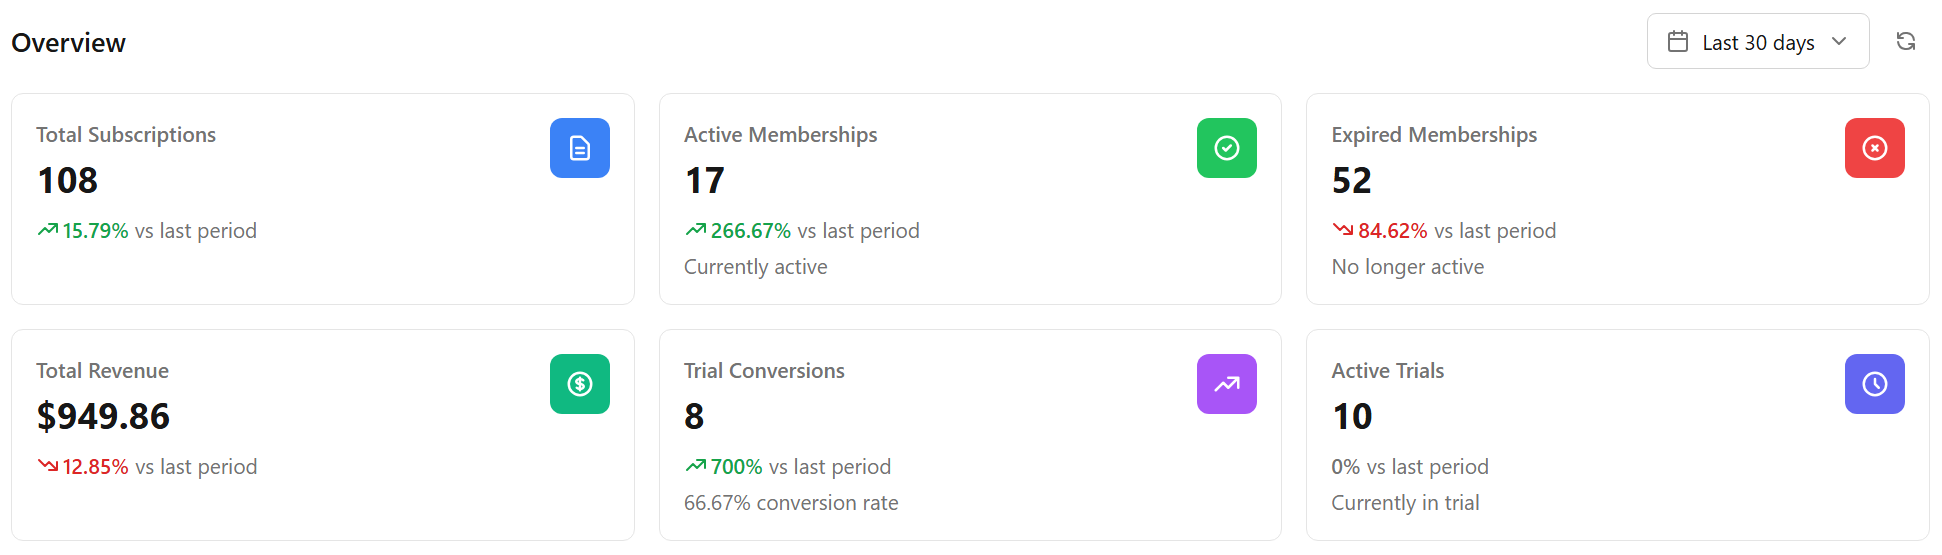
At the top of the page, six stat cards show key metrics and percentage change vs the previous period. Clicking a card can navigate to the related tab (e.g. Revenue → Revenue tab, Trial Conversions → Trial Analytics).
| Card | What it shows |
|---|---|
| Total Subscriptions | Count of subscriptions in the selected period; trend vs last period. |
| Total Revenue | Revenue in the selected period; trend vs last period. |
| Active Memberships | Currently active memberships; “Currently active.” |
| Expired Memberships | No longer active; “No longer active.” |
| Trial Conversions | Number of trials that converted to paid; shows conversion rate %. |
| Active Trials | Subscriptions currently in trial; “Currently in trial.” |
Charts and tables may show “No data for the selected period” or zero values when there is no activity in that range (e.g. no revenue, no gateway data, no trial conversions). Use a wider date range or check that payments and trials are being recorded correctly.
Report tabs
The page has five tabs:

Charts & Analytics
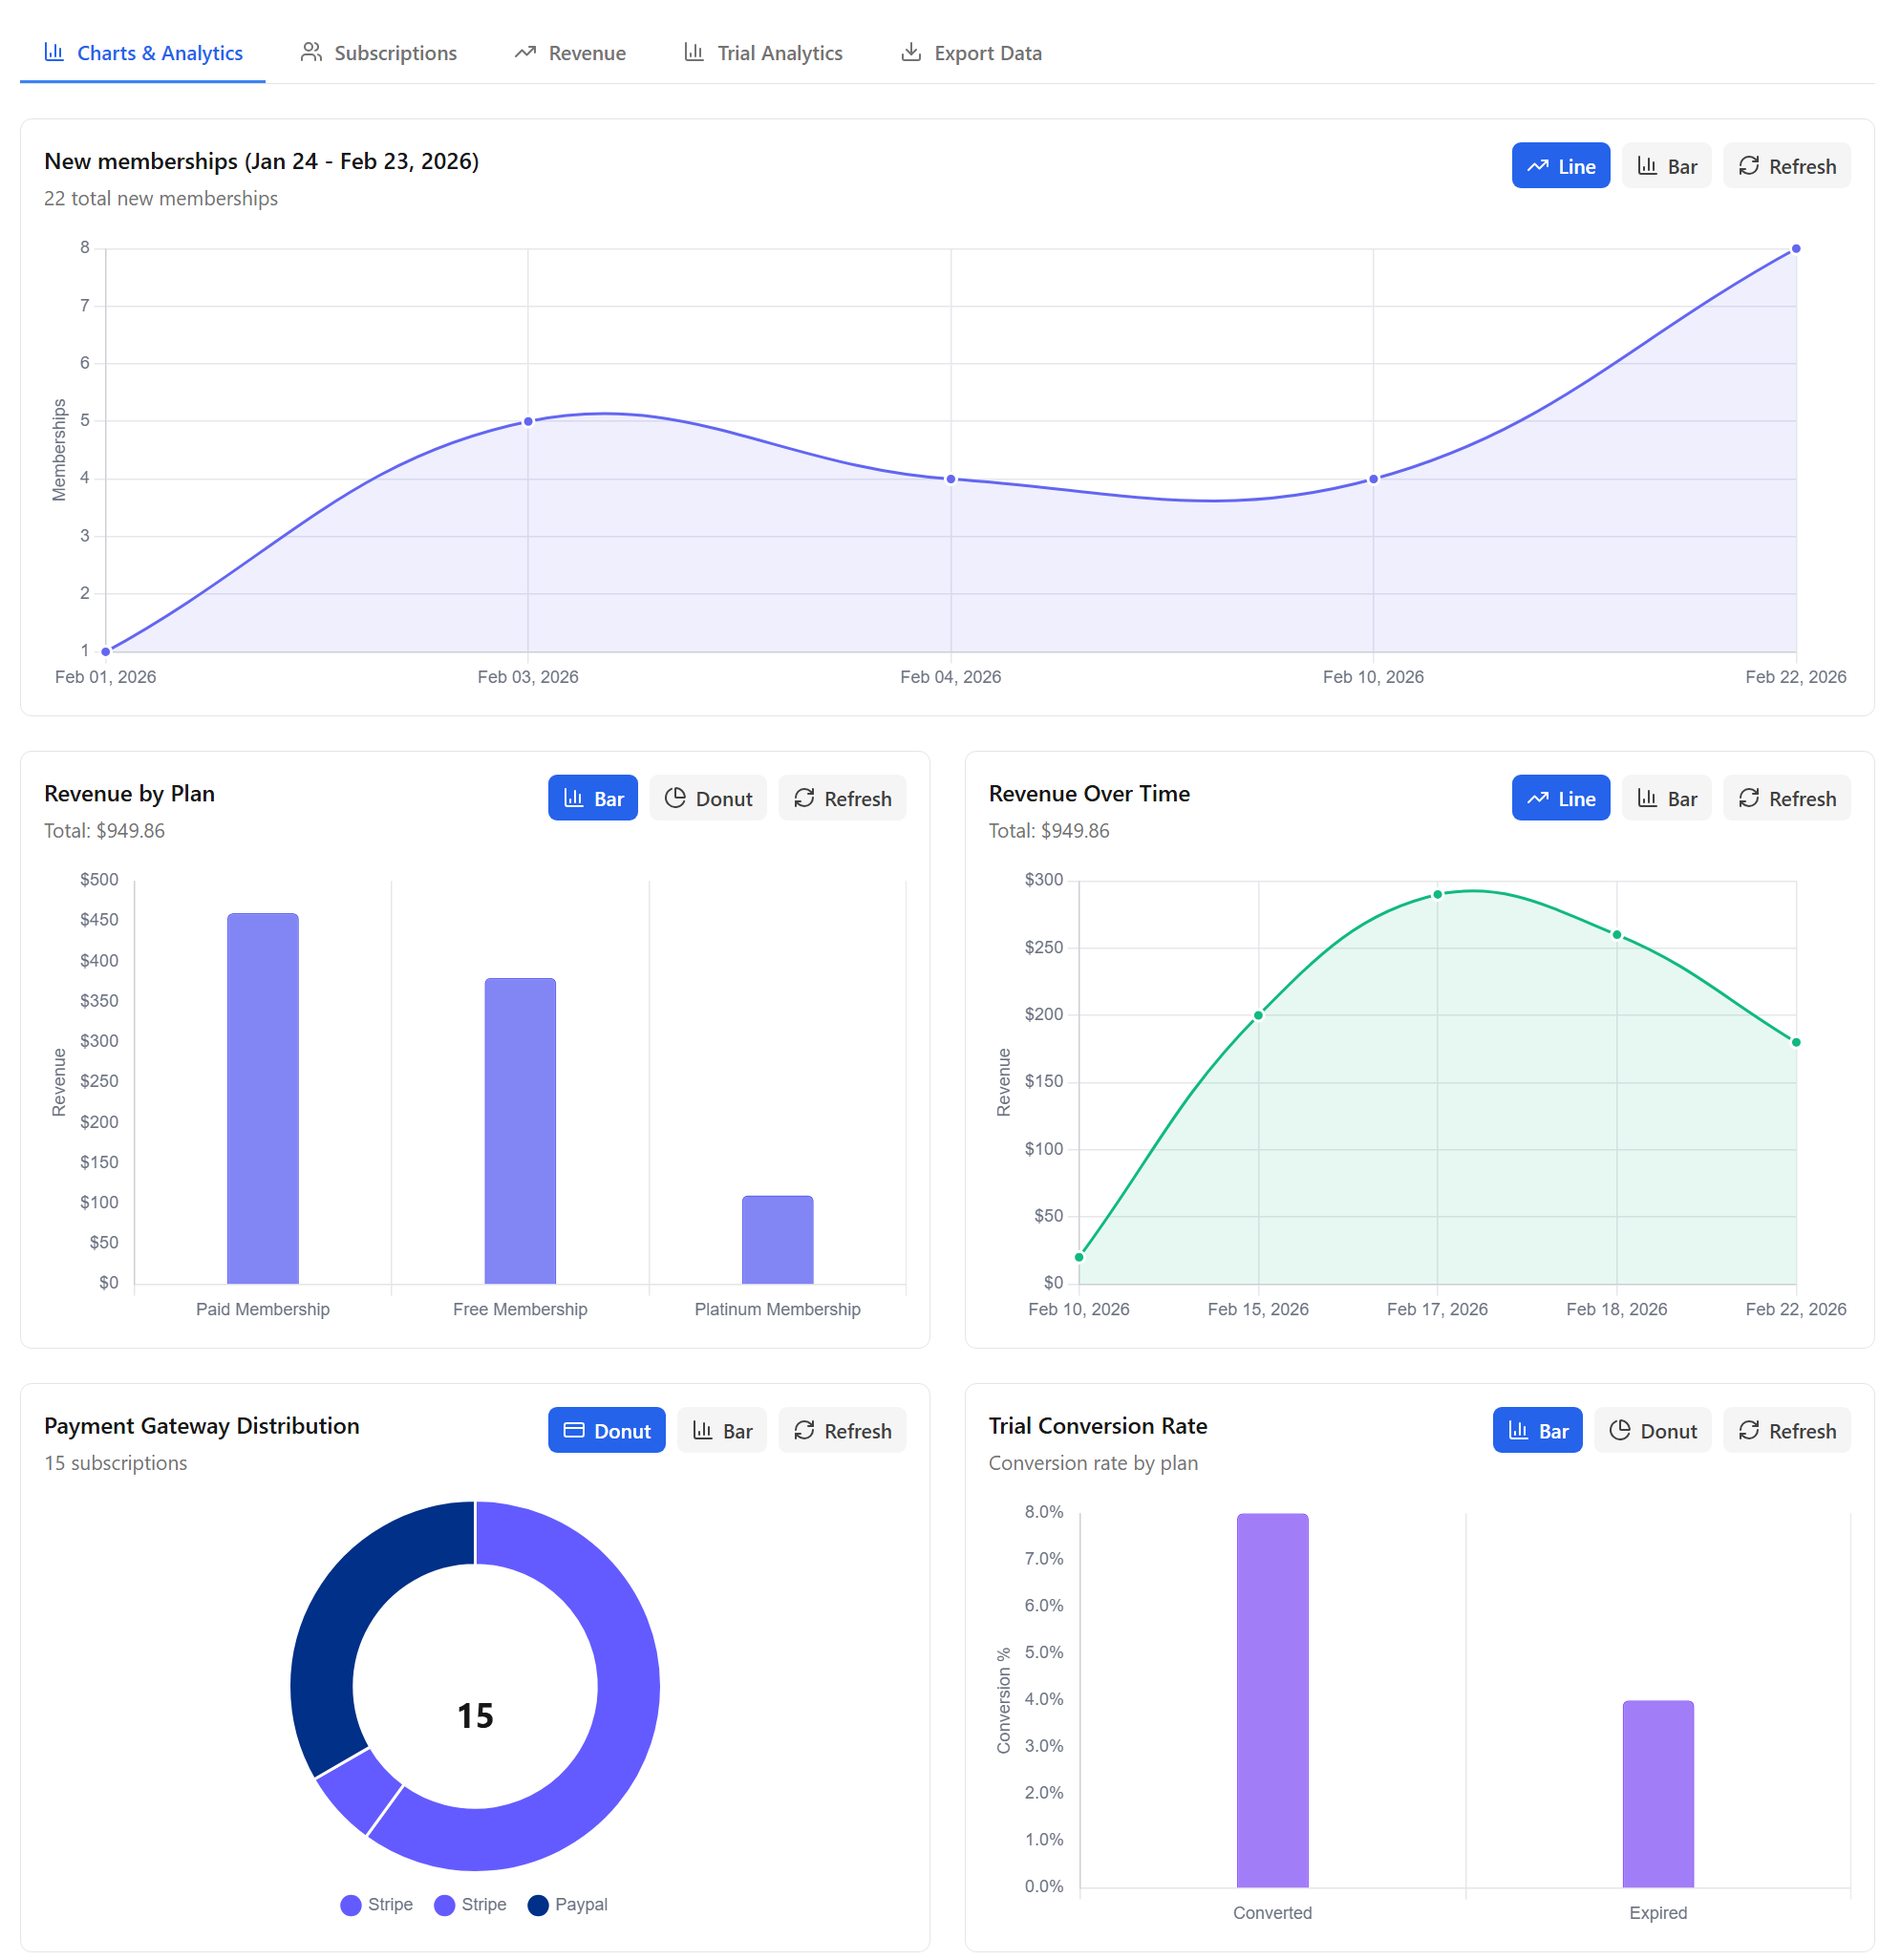
- New memberships — Line or bar chart of new memberships over the date range (e.g. “New memberships (Jan 24 – Feb 23, 2026)”). Toggle Line / Bar and Refresh as needed.
- Revenue by Plan — Bar or donut chart of revenue per membership plan. Shows “No revenue data for the selected period” when there is none.
- Revenue Over Time — Line or bar chart of revenue over time. Same “no data” message when empty.
- Payment Gateway Distribution — Donut or bar chart of revenue by payment gateway (e.g. Stripe, PayPal). Shows “No gateway data for the selected period” when empty.
- Trial Conversion Rate — Bar or donut chart of conversion rate by plan (e.g. Converted vs Expired). Empty when there is no trial data.
Each chart has Line / Bar or Bar / Donut toggles and a Refresh button. Chart type and date range drive what you see; if the period has no activity, charts stay empty.
Subscriptions
Table view of subscriptions with filters (e.g. by status) so you can drill into the list that backs the overview and charts.
Revenue
Revenue-focused view; use it together with the Total Revenue card and the Revenue by Plan / Revenue Over Time charts.
Trial Analytics
Trial-focused data; links from the Trial Conversions and Active Trials overview cards. Use it to see trial conversion and active trial counts in more detail.
Export Data
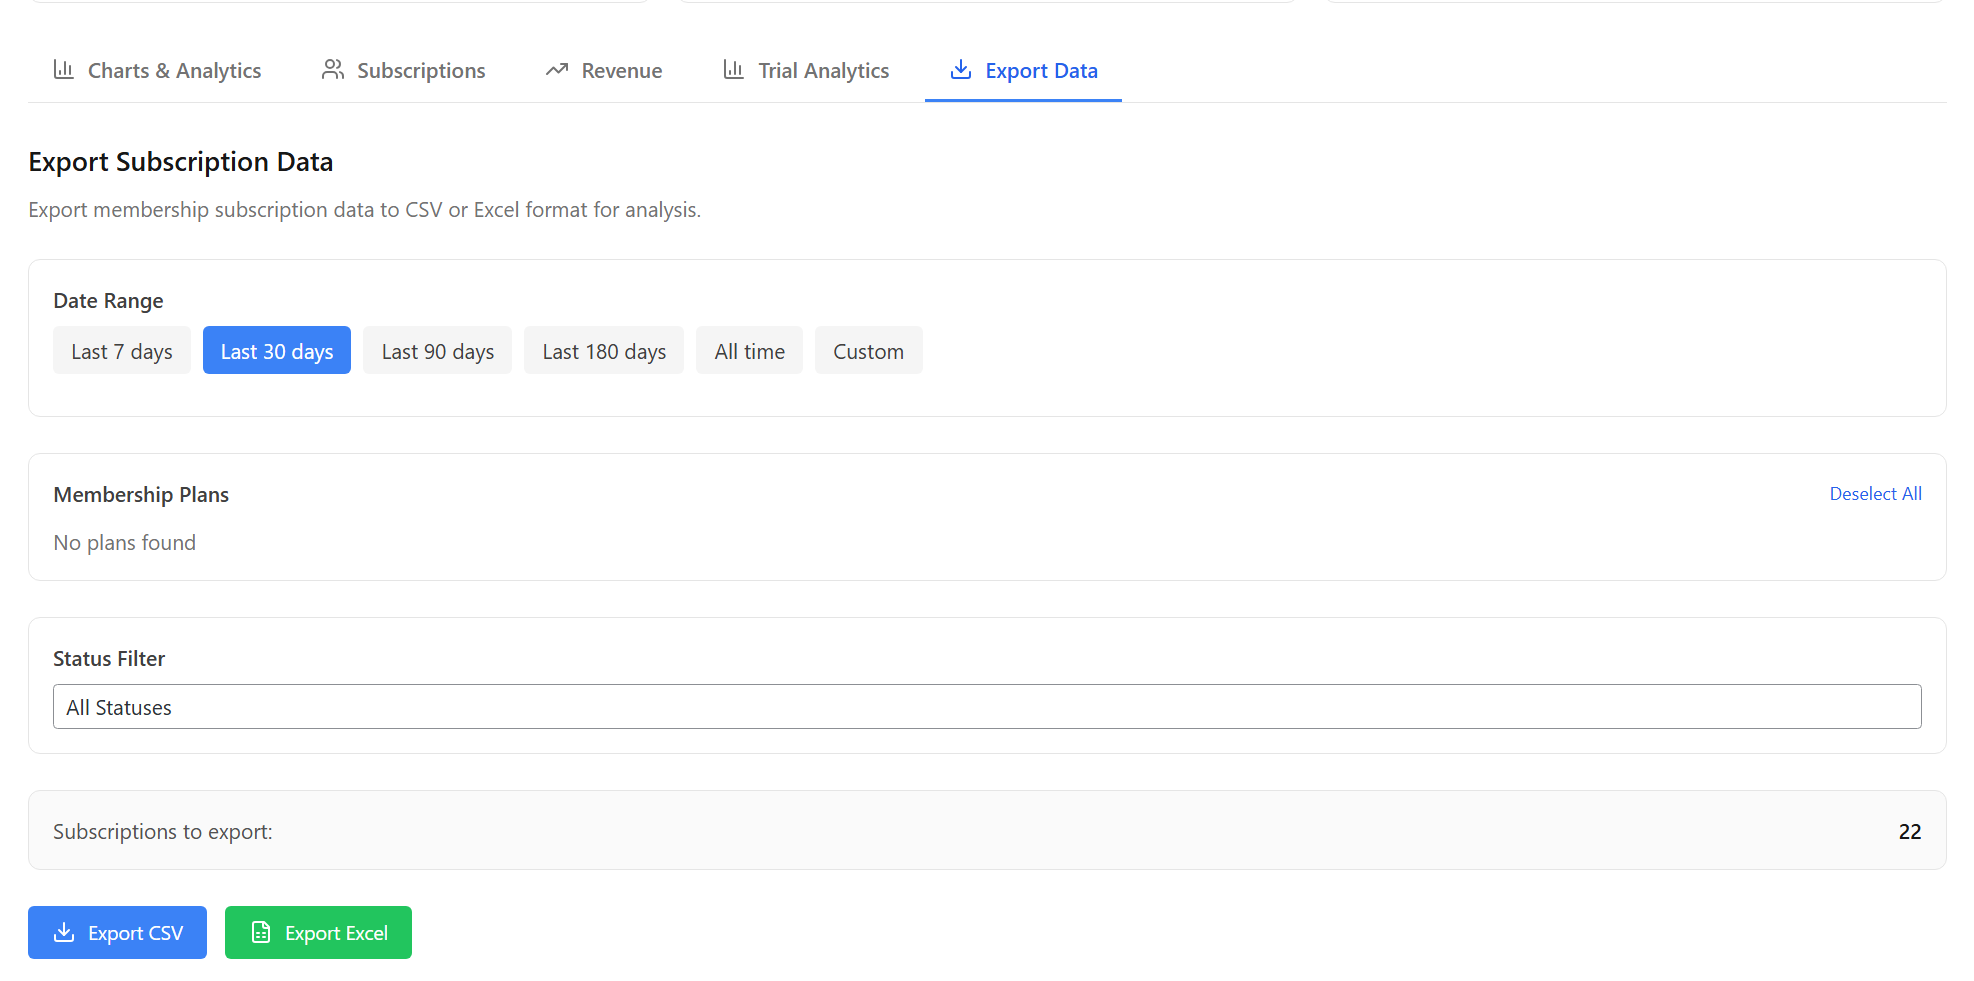
Export subscription data for the selected date range:
- Date range — Presets: Last 7 days, Last 30 days, Last 90 days, Last 180 days, All time, or Custom.
- Plan filter — Optionally limit to specific membership plans.
- Status filter — All, or filter by active, expired, cancelled, trial, etc.
- Format — The current Reports UI exports CSV.
Use Export to download subscription data. For coupon data, use Divi Membership → Reporting → Coupons → CSV export.
What's Next
- Coupons — Create coupons and view usage in the legacy Coupons report.
- Subscription management — Manage individual subscriptions in the admin.
- Free trials — Configure trials; trial conversion and active trials appear in Reports.